Custom MES development · Michigan and nationwide
Custom MES dashboards built around production decisions
Morton Technologies builds manufacturing dashboards that connect operator activity, work orders, equipment events, quality checks, downtime, and ERP data. Each view is designed for the decisions a specific role must make—not as one oversized dashboard for everyone.
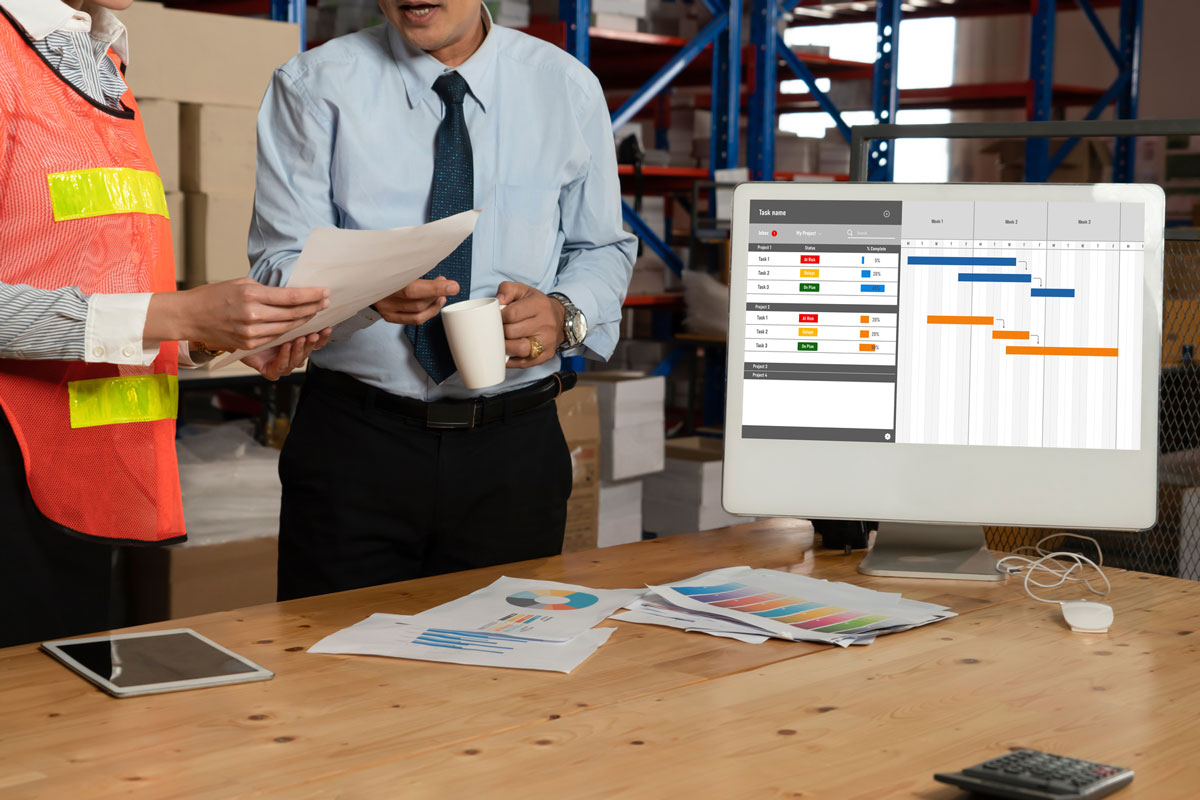
Role-specific views
Show each person the information needed to act
Useful MES dashboards reduce searching and duplicate entry. They preserve the underlying production context while presenting tasks, exceptions, and decisions differently for each role.
Operator dashboard
Current job, product, instructions, target quantity, completed quantity, required checks, material status, downtime entry, and escalation actions.
Supervisor dashboard
Line and cell status, schedule attainment, blocked work, staffing context, downtime, changeovers, exceptions, and shift handoff.
Quality dashboard
Inspections due, holds, nonconformance, specifications, lot genealogy, corrective actions, approvals, and release status.
Maintenance dashboard
Equipment condition, active alarms, repeated downtime reasons, meter readings, service status, and production impact.
Planner dashboard
Order priority, available capacity, constraints, material readiness, planned changeovers, due dates, and schedule conflicts.
Leadership dashboard
Throughput, schedule attainment, yield, scrap, downtime, backlog, quality trends, and the data lineage behind each measure.
Production context
Connect plant signals to work that the business recognizes
Raw PLC and sensor readings rarely answer a production question by themselves. MES logic must associate events with equipment, work orders, products, batches or lots, shifts, operators, specifications, and production states.
- Timestamp and buffer plant events reliably
- Resolve equipment and tag identities
- Associate events with the active production context
- Distinguish planned and unplanned states
- Preserve corrections and approval history
- Exchange reconciled results with ERP and reporting systems
Common integration boundaries
- PLC, sensor, or gateway: equipment events and measurements
- MES: production context, workflow, quality, and traceability
- ERP: orders, inventory, purchasing, labor, and financial records
- CMMS: assets, maintenance work, and service history
- Reporting platform: governed cross-system analysis and distribution
Metrics and definitions
A dashboard is only as trustworthy as its production model
Before presenting OEE, downtime, yield, or schedule attainment, define the source events, exclusions, time boundaries, equipment hierarchy, and correction workflow.
OEE and downtime
Availability, performance, and quality require agreed definitions. Planned downtime, ideal cycle time, microstops, rework, startup scrap, and missing signals can materially change the result.
Morton exposes the component measures and data-quality conditions rather than treating one score as self-explanatory.
Schedule and throughput
Schedule attainment depends on the planning horizon, order priority, partial completion, changeovers, holds, and whether the comparison uses units, standard hours, or another production basis.
The dashboard should make the selected definition and period clear to the people using it.
Shop-floor design
Build for the actual production environment
Operator interfaces may need to work with touchscreens, gloves, glare, shared stations, intermittent connectivity, scanners, or limited time for data entry. The workflow should capture required information without turning the operator into a data clerk.
- Large, clear controls and visible current state
- Fast scanning and minimal repeated entry
- Explicit offline and reconnect behavior
- Permission-aware corrections and approvals
- Actionable alerts instead of uncontrolled notification volume
- Accessible layouts and consistent interaction patterns

How the work begins
Start with one decision-intensive workflow
A focused pilot can validate the production model, integration path, and user experience before expanding across a plant or network.
Observe
Map the work, decisions, exceptions, equipment, systems, and current records.
Model
Define identities, states, events, metrics, ownership, and integration boundaries.
Pilot
Build one representative workflow with real users and representative data.
Expand
Measure adoption, correct the model, and sequence additional equipment or workflows.
Related capabilities
Connect the dashboard to the wider manufacturing system
Manufacturing software
Review Morton’s broader MES, scheduling, traceability, quality, IoT, and ERP integration capabilities.
Michigan manufacturing software →IoT integration
Connect devices, gateways, telemetry, alarms, condition monitoring, and cloud services.
IoT monitoring solutions →Custom software
Build the surrounding workflows, integrations, permissions, reporting, and administration.
Michigan custom software development →Custom MES dashboards
Which production decision needs better visibility?
Tell us how the work is scheduled, recorded, monitored, and reconciled today. We can help define a focused dashboard and integration pilot.
Request a Manufacturing Workflow Assessment